Computing matched envelopes

Author

Austin Hoover

Published

May 13, 2021

My first peer-reviewed paper was published in Physical Review Accelerators and Beams (PRAB) at the end of April [1]. I thought I would summarize the results of the paper here.

1. Self-consistent beam distributions

1.1. Space charge

A beam of charged particles generates an electric field, which then exerts a force on each particle, whose motion modifies the electric field, and so on. This problem is familiar to plasma physics. One important feature of charged particle beams is that they are non-neutral, i.e., all particles have the same charge. Thus, all forces are long-range, making the problem difficult to handle analytically.

Here, I will briefly discuss one way in which space charge limits the performance of particle accelerators. In particular, I will discuss the difficulties caused by the fact that the space charge force on a given particle depends nonlinearly on the particle’s position. For example, consider the following two charge distributions and the radial electric fields they produce.

Imports
#hide
from matplotlib import animation
from matplotlib.lines import Line2D
from matplotlib.patches import Ellipse
from matplotlib import pyplot as plt
import numpy as np
import proplot as pplt
import psdist.visualization as psv
from scipy.integrate import odeint
Code
# Generate a uniform density distribution.
np.random.seed(6)
n = int(1e4)
rho = 2.0 * np.sqrt(np.random.uniform(size=n))
phi = np.random.uniform(0, 2 * np.pi, size=n)
X1 = np.vstack([rho * np.cos(phi), rho * np.sin(phi)]).T

# Generate a Gaussian distribution.
X2 = np.random.normal(scale=1.0, size=(n, 2))

# Plot the distributions.
fig, axs = pplt.subplots(
    nrows=2, ncols=2, figwidth=5.5, span=False, wspace=7.0, height_ratios=[1, 0.3]
)
for ax, X in zip(axs[0, :], [X1, X2]):
    ax.scatter(X[:, 0], X[:, 1], s=0.05, c="k")
axs[0, :].format(aspect=1.0, yticks=[], xspineloc="neither", yspineloc="neither")


# Plot the radial electric field.
def Efield(r, kind="gaussian"):
    if r == 0:
        return 0.0
    if kind == "uniform":
        if abs(r) <= 2.0:
            return 0.25 * r
        else:
            return 1.0 / r
    elif kind == "gaussian":
        return (1.0 / r) * (1.0 - np.exp(-0.5 * r**2))


radii = np.linspace(-4.0, 4.0, 100)
for ax, kind in zip(axs[1, :], ["uniform", "gaussian"]):
    electric_field = np.array([Efield(r, kind) for r in radii])
    ax.plot(radii, electric_field, color="black")
axs[1, :].format(
    ylabel=r"$E_r$",
    xlabel=r"r / $\sigma$",
    xspineloc="bottom",
    yspineloc="left",
    yticks=[0.0],
    ygrid=True,
)
plt.close()

Fig. 1. Comparison of radial electric field generated by a uniform distribution (left) and Gaussian distribution (right).

Fig. 1. Comparison of radial electric field generated by a uniform distribution (left) and Gaussian distribution (right).

The left distribution produces an electric field that is proportional to the radius, i.e., it gives rise to linear space charge forces. The right distribution produces an electric field that depends nonlinearly on the radius, i.e., it gives rise to nonlinear space charge forces.

Nonlinear forces lead to filamentation and effective growth in phase space volume (in a course-grained sense). We typically estimate the phase space volume from the covariance matrix of the distribution: the covariance matrix defines an ellipsoid whose volume is easy to compute. We call this volume the root-mean-square emittance. Emittance growth is generally undesired as it degrades the beam quality and leads to beam loss. Fig. 2. shows an example of the emittance growth that can be caused by the space charge forces in an intense beam propagating in a linear focusing channel.

Fig. 2. Emittance growth in an intense beam propagating in a linear accelerator. The emittances \varepsilon_{x,y} correspond to the areas in the projected phase spaces x-p_x and y-p_y (Source: [2].)

Fig. 2. Emittance growth in an intense beam propagating in a linear accelerator. The emittances \(\varepsilon_{x,y}\) correspond to the areas in the projected phase spaces \(x\)-\(p_x\) and \(y\)-\(p_y\) (Source: [2].)

Another difficulty is specific to circular accelerators (rings). Rings are designed such that each particle performs stable transverse oscillations about some reference trajectory. The oscillations are not simple-harmonic, but they can be described by a small number of parameters.1 One of these parameters is the tune, which is something like a frequency. For certain values of the tune, nonlinear magnetic fields in the ring can drive single-particle resonances.2 To avoid resonance conditions up to order \(|M_x + M_y|\), the tunes \(\nu_{x, y}\) must be far from the lines defined by \(M_x \nu_x + M_y \nu_y = N\), where \(M_x\), \(M_y\), and \(N\) are integers.

Space charge decreases the tune of each particle. This wouldn’t be a problem if the shift was the same for each particle, but a nonlinear space charge force causes the tune shift to depend on the particle’s position, resulting in a tune spread that grows with the beam intensity. At high intensities, it becomes unavoidable that some particles cross dangerous low-order resonance lines. This is illustrated in Fig. 3.

Fig. 3. Simulated tune spread in the SNS ring. (Source: [3].)

Fig. 3. Simulated tune spread in the SNS ring. (Source: [3].)

It seems plausible that a beam producing linear space charge forces would alleviate these problems, enabling higher beam intensities. We already have an example of one such beam in Fig. 1: a uniform-density ellipse. But if we transported this beam through an accelerator, would its uniform density be maintained? There are only a few cases in which the answer is “yes”; we call these cases self-consistent.

1.2. Vlasov equilibria

To evolve the beam, we need to specify not only the distribution of particle positions but also the distribution of velocities; in other words, we need to specify the distribution in four-dimensional position-momentum space (phase space). We then apply the framework of statistical mechanics, which I will briefly summarize.

A collisionless, two-dimensional[^By two-dimensional, we mean that the beam extends forever in the \(z\) direction.] beam of charged particles may be represented by a distribution function \(f(\mathbf{x}, \mathbf{x}', s)\), where \(\mathbf{x} = (x, y)^T\) is the transverse position, \(\mathbf{x}' = d\mathbf{x}/ds\) is the transverse momentum, \(s = \beta c t\) is the axial position, \(t\) is the time, \(\beta c\) is the beam velocity, and \(c\) is the speed of light. In a linear, uncoupled focusing system represented by \(\mathbf{\kappa(s)}\), the distribution function evolves according to the Vlasov-Poisson system of equations:

\[ \frac{\partial{f}}{\partial{s}} + \mathbf{x}'\cdot \frac{\partial{f}}{\partial{\mathbf{x}}} + \mathbf{x}'' \cdot \frac{\partial{f}}{\partial{\mathbf{x}'}} = 0. \tag{1}\]

\[ \mathbf{x}'' + \mathbf{\kappa}(s)\mathbf{x} = -\frac{q}{mc^2\beta^2\gamma^3} \frac{\partial \Phi}{\partial \mathbf{x}}. \tag{2}\]

Here \(q\) is the charge, \(m\) is the mass, \(\gamma = \left(1 - \beta^2\right)^{-1/2}\), and the electric potential \(\Phi\) is determined self-consistently from the Poisson equation:

\[ -\frac{\partial^2 \Phi}{\partial \mathbf{x}^2} = \frac{q}{\varepsilon_0} \int{f(\mathbf{x}, \mathbf{x}', s) \mathbf{dx}'}. \tag{3}\]

This highly nonlinear integro-differential system of equations is difficult to solve analytically. Exact solutions are called equilibrium distributions and have the form \(f = f(\{C_i\}),\) where \(\{C_i\}\) are invariants of the motion. When the focusing is time-independent (\(\mathbf{\kappa}(s) = \mathbf{\kappa}\)), the Hamiltonian is an invariant and any function of the Hamiltonian is an equilibrium distribution. But when the focusing is time-dependent, the solution is unclear.

For some time, only one solution existed for linear time-dependent systems, but recently, at least one additional solution has been found. Both solutions project to a uniform density ellipse in the \(x\)-\(y\) plane, producing linear space charge forces. And since they are equilibrium solutions, they are guaranteed to maintain their functional form as they evolve. This is just what we define as a self-consistent distribution; self-consistent distributions are the subset of Vlasov equilibrium distributions that produce linear space charge forces. I will not discuss how these solutions are found in this post. I will instead focus on some of their properties.

1.2. KV distribution

The first self-consistent distribution was derived by a pair of Russian scientists in 1959 and is known as the KV distribution. Particles in the KV distribution uniformly populate the boundary of an ellipsoid in four-dimensional (4D) phase space. In normalized coordinates, it looks something like

\[ f(x, p_x, y, p_y) = \delta(x^2 + {p_y}^2 + y^2 + {p_y}^2 - 1), \tag{4}\]

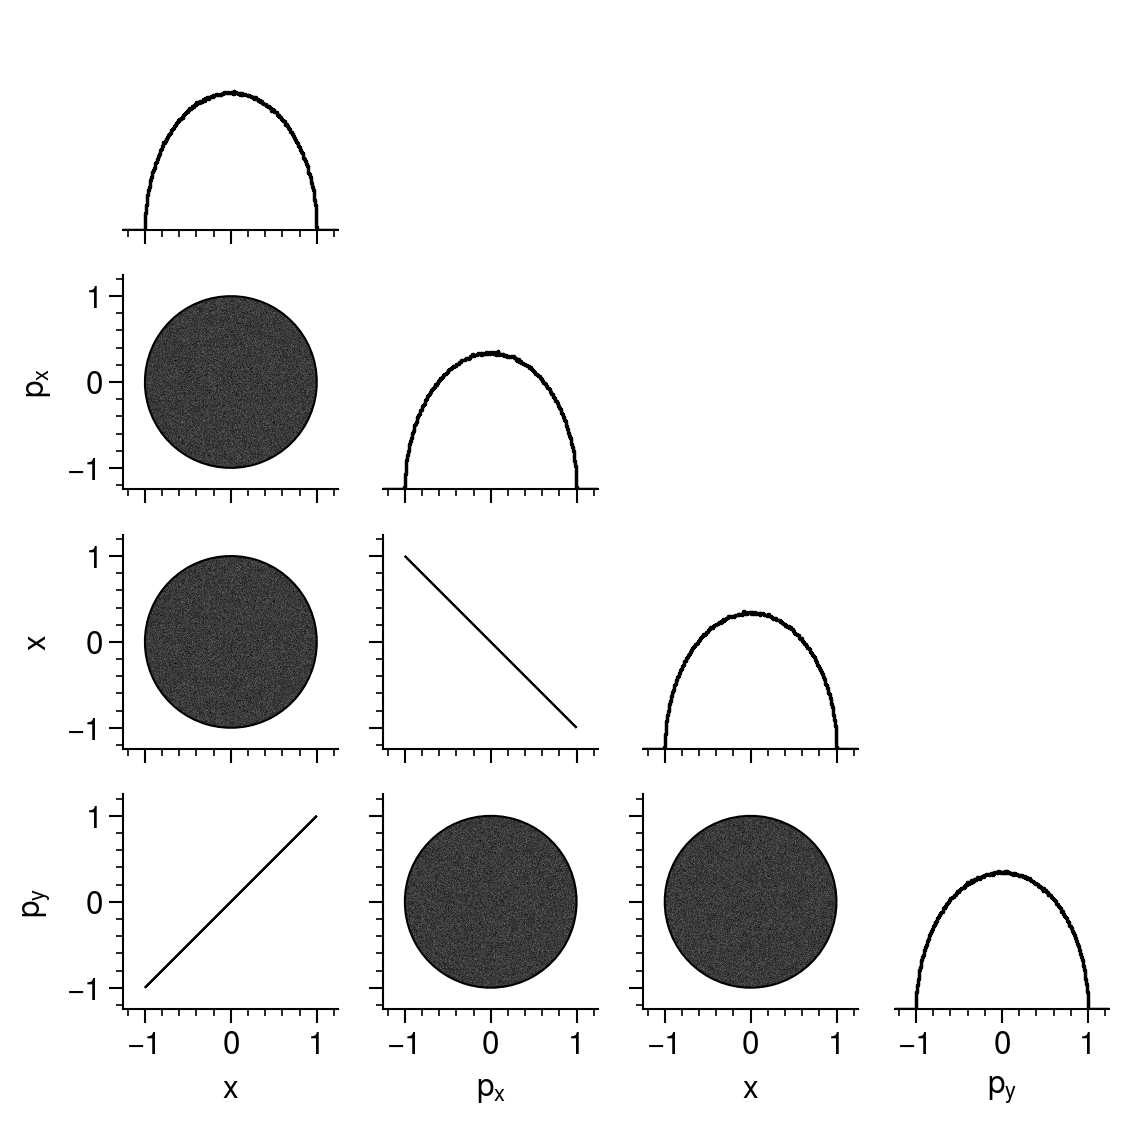
where \(\delta\) is the Diract delta function. Any 2D projection of this 4D shell is a uniform density ellipse.

Code
X = np.random.normal(size=(int(7e6), 4))
X = np.apply_along_axis(lambda x: x / np.linalg.norm(x), 1, X)
grid = psv.cloud.corner(
    X,
    autolim_kws=dict(pad=0.25),
    labels=[r"$x$", r"$p_x$", r"$x$", r"$p_y$"],
    grid_kws=dict(figwidth=4.5),
    rms_ellipse=True,
    rms_ellipse_kws=dict(level=2.0),
)
plt.close()

Fig. 4. 1D and 2D projections of the KV distribution.

Fig. 4. 1D and 2D projections of the KV distribution.

It can be (not easily) shown that the electric field within a uniform-density upright ellipse is

\[ \mathbf{E}(x, y) \propto \frac{x}{c_x (c_x + c_y)} \hat{x} + \frac{y}{c_y (c_x + c_y)} \hat{y}, \tag{5}\]

where \(c_x\) and \(c_y\) are the semi-axes of the ellipse. Notice that the field is both linear and uncoupled — \(x\) component of the field is proportional to \(x\); the \(y\) component of the field is proportional to \(y\).

From here, one can derive a system of differential equations to evolve the distribution. This is an incredible simplification of the Vlasov-Poisson system. The equations track the beam envelope, the elliptical boundary containing the particles in the \(x\)-\(y\) plane. These envelope equations, as they’re called, have been important for understanding space charge effects. In addition to providing a theoretical benchmark for computer simulations, they capture the approximate behavior of more realistic beams in some cases.3 More details are in  [4].

Let’s try integrating these equations in a simple periodic focusing system.

def fodo(s, quad_strength=0.556, cell_length=5.0):
    s = (s % cell_length) / cell_length
    delta = 0.125
    if s < delta or s > 1 - delta:
        return +quad_strength
    elif 0.5 - delta <= s < 0.5 + delta:
        return -quad_strength
    return 0.0


def kv_derivs(params, s, Q, foc):
    cx, cxp, cy, cyp = params
    k0x = foc(s)
    k0y = -k0x
    w = np.zeros(4)
    w[0] = cxp
    w[2] = cyp
    w[1] = -k0x * cx + 2.0 * Q / (cx + cy) + 16.0 * epsx**2 / (cx**3)
    w[3] = -k0y * cy + 2.0 * Q / (cx + cy) + 16.0 * epsy**2 / (cy**3)
    return w


def track_kv(params, positions, Q, foc):
    tracked = odeint(kv_derivs, params, positions, args=(Q, foc))
    sizes = tracked[:, [0, 2]]
    sizes = sizes * 1000.0  # convert to mm
    return sizes


# Create KV envelope
alphax, alphay, betax, betay = 0.0, 0.0, 8.017, 1.544
epsx = epsy = 10e-6
cx = 2 * np.sqrt(epsx * betax)
cy = 2 * np.sqrt(epsy * betay)
cxp = cyp = 0.0
params = [cx, cxp, cy, cyp]

# Integrate envelope equations
cell_length = 5.0
periods = 4
npts = 1000
positions = np.linspace(0, cell_length * periods, npts)
Q = 1.0e-5
sizes = track_kv(params, positions, Q, fodo)
sizes0 = track_kv(params, positions, 0.0, fodo)
Code
colors = pplt.Cycle("colorblind").by_key()["color"]
kws1 = dict(fc="lightgrey", lw=0.75, ec="None")
kws2 = dict(fill=False, ls="--", color="k", lw=0.5, alpha=0.5)
stride = 10
umin = np.min(sizes)
umax = np.max(sizes)
umax_pad = 1.25 * umax

fig, axs = pplt.subplots(
    nrows=2,
    ncols=2,
    figsize=(7, 2.5),
    spany=False,
    aligny=True,
    sharey=False,
    sharex=False,
    hspace=0.2,
    height_ratios=[5.0, 1.0],
    width_ratios=[2.75, 1.0],
)
axs[0, 0].format(xlabel="", ylabel="Beam size [mm]", ylim=(umin - 5, umax + 5))
axs[1, 0].format(xlabel="s [m]", ylabel=r"$k_x$", yticks=[0], ylim=(-0.6116, 0.6116))
axs[:, 0].format(xlim=positions[[0, -1]])
axs[1, 0].spines["top"].set_visible(False)
axs[0, 1].format(
    xticklabels=[],
    yticklabels=[],
    xlabel="x",
    ylabel="y",
    xlim=(-umax_pad, umax_pad),
    ylim=(-umax_pad, umax_pad),
)
axs[0, 1].format(xspineloc="bottom", yspineloc="left")
axs[1, 1].axis("off")
axs[0, 0].format(xticklabels=[])
axs[0, 0].legend(
    handles=[Line2D([0], [0], color=colors[0]), Line2D([0], [0], color=colors[1])],
    labels=[r'$\sqrt{\langle{x^2}\rangle}$', r'$\sqrt{\langle{y^2}\rangle}$'],
    ncols=1,
    loc="upper left",
    fontsize="small",
    handlelength=1.5,
)
axs[1, 0].plot(positions, [fodo(s) for s in positions], color="k", lw=1)
plt.close()


(line1,) = axs[0, 0].plot([], [])
(line2,) = axs[0, 0].plot([], [])
axs[0, 0].format(cycle="colorblind")
(line3,) = axs[0, 0].plot([], [], ls="--", lw=0.5)
(line4,) = axs[0, 0].plot([], [], ls="--", lw=0.5)


def update(i):
    i = i * stride
    line1.set_data(positions[:i], sizes[:i, 0])
    line2.set_data(positions[:i], sizes[:i, 1])
    line3.set_data(positions[:i], sizes0[:i, 0])
    line4.set_data(positions[:i], sizes0[:i, 1])
    for patch in axs[0, 1].patches:
        patch.set_visible(False)
        
    for _sizes, _kws in zip([sizes, sizes0], [kws1, kws2]):
        axs[0, 1].add_patch(
            Ellipse((0, 0), 2.0 * _sizes[i, 0], 2.0 * _sizes[i, 1], **_kws)
        )


anim = animation.FuncAnimation(
    fig, update, frames=len(positions[::stride]), interval=(1000.0 / 14.0)
)
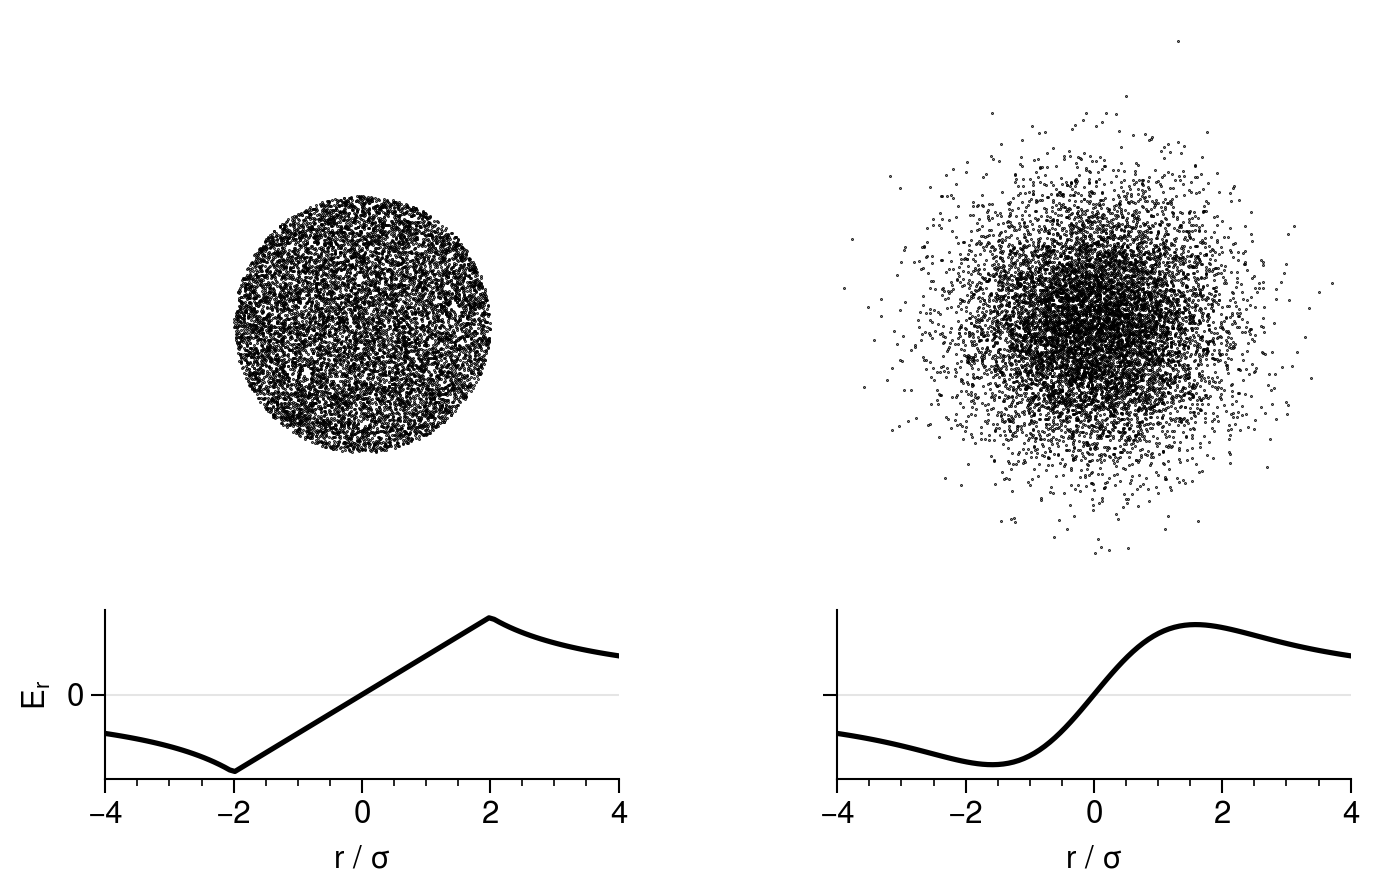
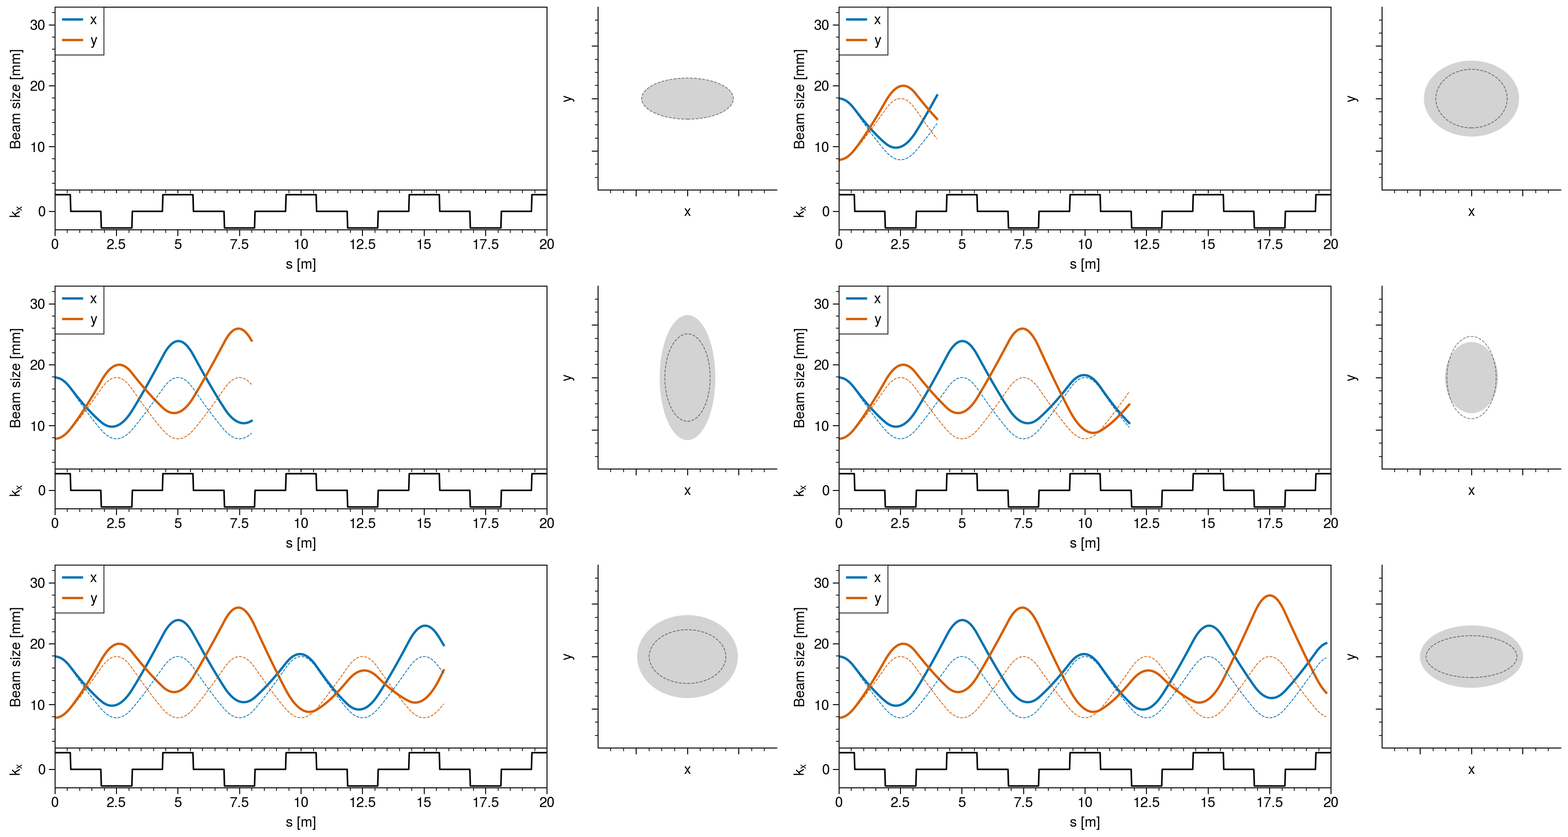
Fig. 5. Evolution of the KV distribution in a FODO lattice. Top left: horizontal and vertical beam size. Bottom left: Lattice focusing strength. Right: beam ellipse in the x-y plane. Dashed lines are without space charge and solid lines are with space charge.

Fig. 5. Evolution of the KV distribution in a FODO lattice. Top left: horizontal and vertical beam size. Bottom left: Lattice focusing strength. Right: beam ellipse in the \(x\)-\(y\) plane. Dashed lines are without space charge and solid lines are with space charge.

Notice that space charge causes mismatch oscillations: without space charge, the beam repeats after each focusing period. More on this in a moment.

1.4. Danilov distribution

Recently, a larger class of self-consistent distributions was discovered. It has the following form.

\[ f(x, p_x, y, p_y) = \delta(p_x - e_{11} x - e_{12} y) \delta(p_y - e_{21} x - e_{22} y), \tag{6}\]

where the \(e_{ij}\) terms are constants. Suppose \(e_{11} = e_{22} = 0\) and \(e_{21} = -e_{12} = 1\) so that \(p_y = x\) and \(p_x = -y\); this describes a rotating rigid disk. Here are the 1D and 2D projections in this case:

Code
X = np.random.normal(size=(int(7e6), 4))
X = np.apply_along_axis(lambda x: x / np.linalg.norm(x), 1, X)
X[:, 3] = +X[:, 0]
X[:, 1] = -X[:, 2]
grid = psv.cloud.corner(
    X,
    autolim_kws=dict(pad=0.25),
    labels=[r"$x$", r"$p_x$", r"$x$", r"$p_y$"],
    grid_kws=dict(figwidth=4.5),
    rms_ellipse=True,
    rms_ellipse_kws=dict(level=2.0),
)
plt.close()

Fig. 6. 1D and 2D projections of the Danilov distribution.

Fig. 6. 1D and 2D projections of the Danilov distribution.

In general, the particles in the beam swirl in a vortex pattern within an ellipse, always with a uniform density. It is also apparently possible to construct this type of vortex distribution in six-dimensional phase space, which is not true of the KV distribution.

We can again derive equations for the elliptical beam envelope, but they are now going to include coupling between \(x\) and \(y\). This is because the beam ellipse tiltes in the \(x\)-\(y\)- plane, producing a term proportional to \(xy\) in the electric field. More details can be found in [5].

def get_tilt_angle(a, b, e, f):
    return -0.5 * np.arctan2(2.0 * (a * e + b * f), a**2 + b**2 - e**2 - f**2)


def get_radii(a, b, e, f):
    phi = get_tilt_angle(a, b, e, f)
    sin, cos = np.sin(phi), np.cos(phi)
    sin2, cos2 = sin**2, cos**2
    xx = a**2 + b**2
    yy = e**2 + f**2
    xy = a * e + b * f
    cx = np.sqrt(abs(xx * cos2 + yy * sin2 - 2 * xy * sin * cos))
    cy = np.sqrt(abs(xx * sin2 + yy * cos2 + 2 * xy * sin * cos))
    return cx, cy


def danilov_derivs(params, s, Q, foc):
    k0x = foc(s)
    k0y = -k0x
    a, b, ap, bp, e, f, ep, fp = params
    phi = get_tilt_angle(a, b, e, f)
    cx, cy = get_radii(a, b, e, f)
    cos, sin = np.cos(phi), np.sin(phi)
    cos2, sin2, sincos = cos**2, sin**2, sin * cos
    T = 2.0 * Q / (cx + cy)
    w = np.zeros(8)
    w[0] = ap
    w[1] = bp
    w[4] = ep
    w[5] = fp
    w[2] = -k0x * a + T * ((a * cos2 - e * sincos) / cx + (a * sin2 + e * sincos) / cy)
    w[3] = -k0x * b + T * ((e * sin2 - a * sincos) / cx + (e * cos2 + a * sincos) / cy)
    w[6] = -k0y * e + T * ((b * cos2 - f * sincos) / cx + (b * sin2 + f * sincos) / cy)
    w[7] = -k0y * f + T * ((f * sin2 - b * sincos) / cx + (f * cos2 + b * sincos) / cy)
    return w


def track_danilov(params, positions, Q, foc):
    tracked = odeint(danilov_derivs, params, positions, args=(Q, foc))
    a, b, ap, bp, e, f, ep, fp = tracked.T
    xsizes = np.sqrt(a**2 + b**2)
    ysizes = np.sqrt(e**2 + f**2)
    sizes = np.vstack([xsizes, ysizes]).T * 1000
    cx, cy = get_radii(a, b, e, f)
    radii = np.vstack([cx, cy]).T * 1000
    angles = np.degrees(get_tilt_angle(a, b, e, f))
    return sizes, radii, angles


# (Calculated matched initial parameters offline)
params = np.array([0.0179, 0.0, 0, 0.0022, 0, -0.0079, 0.0051, 0])
positions = np.linspace(0.0, 20.0, 1000)
sizes, radii, angles = track_danilov(params, positions, Q, fodo)
sizes0, radii0, angles0 = track_danilov(params, positions, 0.0, fodo)
Code
umin = np.min(sizes)
umax = np.max(sizes)
umax_pad = 1.25 * umax

fig, axs = pplt.subplots(
    nrows=2,
    ncols=2,
    figsize=(7, 2.5),
    spany=False,
    aligny=True,
    sharey=False,
    sharex=False,
    hspace=0.2,
    height_ratios=[5.0, 1.0],
    width_ratios=[2.75, 1.0],
)
axs[0, 0].format(xlabel="", ylabel="Beam size [mm]", ylim=(umin - 5, umax + 5))
axs[1, 0].format(xlabel="s [m]", ylabel=r"$k_x$", yticks=[0], ylim=(-0.6116, 0.6116))
axs[:, 0].format(xlim=positions[[0, -1]])
axs[1, 0].spines["top"].set_visible(False)
axs[0, 1].format(
    xticklabels=[],
    yticklabels=[],
    xlabel="x",
    ylabel="y",
    xlim=(-umax_pad, umax_pad),
    ylim=(-umax_pad, umax_pad),
)
axs[0, 1].format(xspineloc="bottom", yspineloc="left")
axs[1, 1].axis("off")
axs[0, 0].format(xticklabels=[])
axs[0, 0].legend(
    handles=[Line2D([0], [0], color=colors[0]), Line2D([0], [0], color=colors[1])],
    labels=[r'$\sqrt{\langle{x^2}\rangle}$', r'$\sqrt{\langle{y^2}\rangle}$'],
    ncols=1,
    loc="upper left",
    fontsize="small",
    handlelength=1.5,
)
axs[1, 0].plot(positions, [fodo(s) for s in positions], color="k", lw=1)
plt.close()


line1, = axs[0, 0].plot([], [])
line2, = axs[0, 0].plot([], [])
axs[0, 0].format(cycle='colorblind')
line3, = axs[0, 0].plot([], [], ls='--', lw=0.5)
line4, = axs[0, 0].plot([], [], ls='--', lw=0.5)


def update(i):
    i *= stride
    line1.set_data(positions[:i], sizes[:i, 0])
    line2.set_data(positions[:i], sizes[:i, 1])
    line3.set_data(positions[:i], sizes0[:i, 0])
    line4.set_data(positions[:i], sizes0[:i, 1])
    for patch in axs[0, 1].patches:
        patch.set_visible(False)
    axs[0, 1].add_patch(
        Ellipse(
            (0, 0), 2.0 * radii[i, 0], 2.0 * radii[i, 1], angles[i], 
            fc='lightgrey', lw=0.75, ec='None'
        )
    )
    axs[0, 1].add_patch(
        Ellipse(
            (0, 0), 2.0 * radii0[i, 0], 2.0 * radii0[i, 1], angles0[i], 
            fill=False, ls='--', color='k', lw=0.5, alpha=0.5,
        )
    )

    
anim = animation.FuncAnimation(
    fig, update, frames=len(positions[::stride]), interval=(1000.0 / 14.0)
)

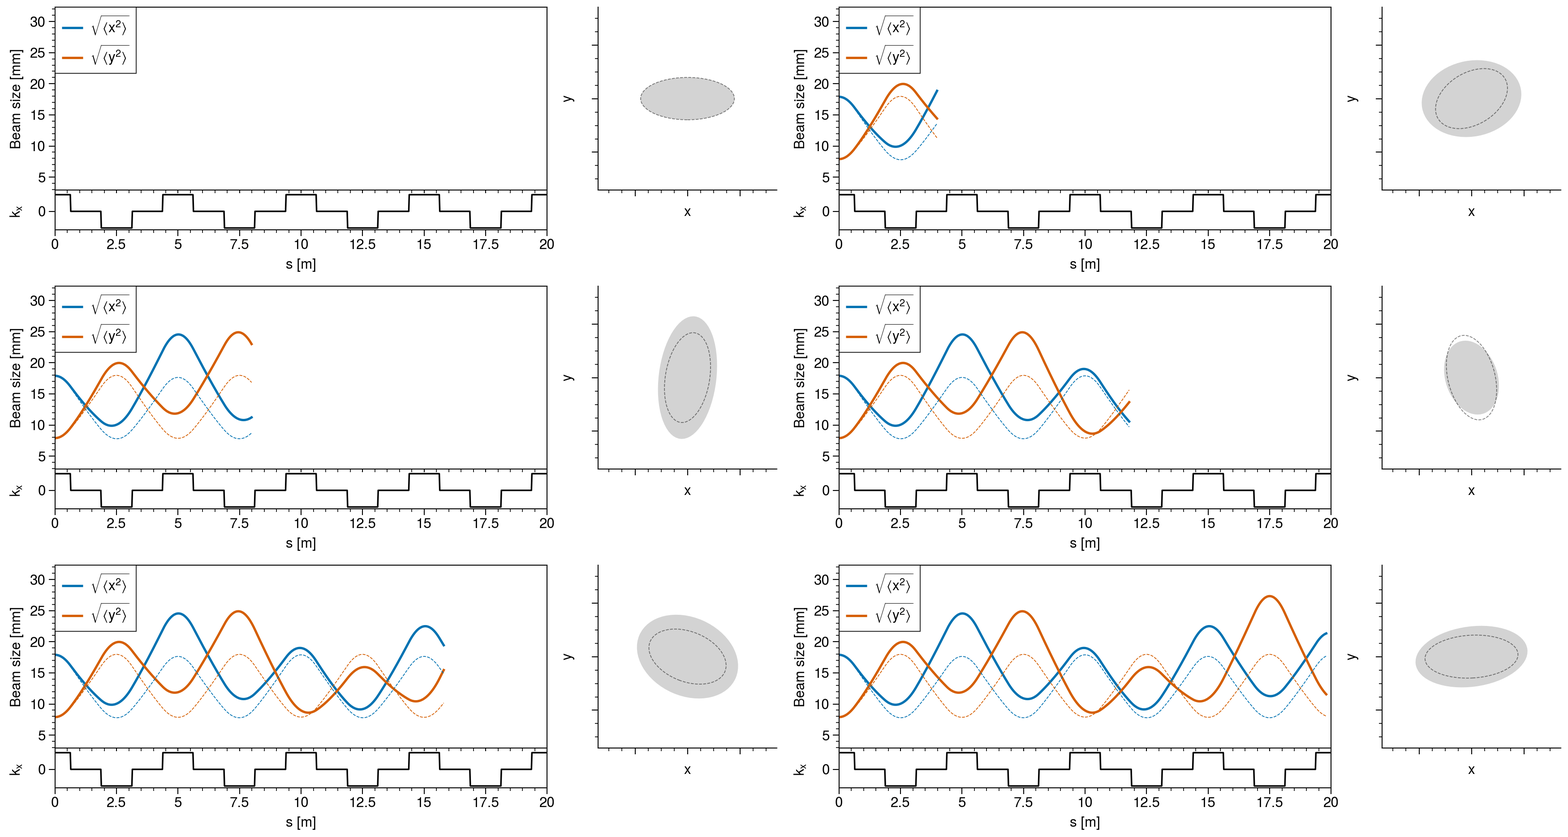
Fig. 7. Evolution of the Danilov distribution in a FODO lattice. Top left: horizontal and vertical beam size. Bottom left: Lattice focusing strength. Right: beam ellipse in the x-y plane. Dashed lines are without space charge and solid lines are with space charge.

Fig. 7. Evolution of the Danilov distribution in a FODO lattice. Top left: horizontal and vertical beam size. Bottom left: Lattice focusing strength. Right: beam ellipse in the \(x\)-\(y\) plane. Dashed lines are without space charge and solid lines are with space charge.

Notice that the beam tilts even without space charge. This has to do with the phase relationship between \(x\) and \(y\). When the beam is upright in the \(x\)-\(y\) plane, \(x\) and \(y\) are 90 degrees out of phase (think of circular motion); on the other hand, a 0 or 180-degree phase difference would lead to a diagonal line in the \(x\)-\(y\) plane and no correlations in \(x\)-\(p_y\) or \(y\)-\(p_x\).

What is a bit less obvious is how space charge affects the beam when it tilts. Although the forces are still linear, the areas of the \(x\)-\(p_x\) and \(y\)-\(p_y\) projections are longer conserved. Below is an example of a turn-by-turn plot (1 turn = 1 period = 5 meters in the above example) in which there are two frequencies involved: a faster oscillation of the beam envelope, and a slower oscillation corresponding to emittance exchange. This kind of emittance exchange is typical of linear coupling.

Fig. 8. Period-by-period evolution of a mismatched Danilov distribution.

Fig. 8. Period-by-period evolution of a mismatched Danilov distribution.

2. Finding the matched solution

2.1. The problem

I’ll now move on to describing the problem we addressed in the paper. Notice that the focusing strength repeats itself after five meters; we call this the period length. A beam is matched to the lattice if its covariance matrix \(\mathbf{\Sigma}\) repeats itself:

\[ \mathbf{\Sigma}(s + L) = \Sigma(s) \tag{7}\]

for all \(s\), where \(s\) is the position in the lattice, \(L\) is the period length, and \(\Sigma\) is the covariance matrix given by

\[ \mathbf{\Sigma} = \begin{bmatrix} \langle{x x}\rangle & \langle{x p_x}\rangle & \langle{x y}\rangle & \langle{x p_y}\rangle \\ \langle{x p_x}\rangle & \langle{p_x p_x}\rangle & \langle{y p_x}\rangle & \langle{p_x p_y}\rangle \\ \langle{x y}\rangle & \langle{y p_x}\rangle & \langle{y y}\rangle & \langle{y p_y}\rangle \\ \langle{x p_y}\rangle & \langle{p_x p_y}\rangle & \langle{y p_y}\rangle & \langle{p_y p_y}\rangle \\ \end{bmatrix} \tag{8}\]

(assuming all means are zero). So the matched beam has not only the same shape and orientation in the \(x\)-\(y\) plane, but also the same spread in velocities and correlations between the positions and velocites. Finding the matched beam amounts to choosing the correct initial \(\mathbf{\Sigma}\) such that Equation 7 is true. This task is trivial without space charge but difficult with space charge.

The matched envelope is useful for theoretical studies. First, it is a sort of minimum energy solution, minimizing the free energy available to drive emittance growth. Second, it is the most radially compact solution for a given beam intensity. Third, knowledge of the matched envelope is required to analyze the stability of the distribution.4 The matched envelope may also be useful in experimental studies. It appears possible to generate an approximate Danilov distribution in a real accelerator, but the method would not work without knowledge of the matched envelope.5

Our strategy was to solve the problem in simple cases, studying the properties of the matched solution as a function of intensity. There were two challenges to overcome. First, space charge causes the final beam to depend on the initial beam in a potentially complicated way that is unknown before tracking the beam; this is especially true for long lattices and large beam intensities. This meant we would need to iterate to find the solution. Second, it was not immediately clear how to vary the distribution during the search; the full covariance matrix has ten unique elements, and they cannot be varied freely since the covariance matrix must remain positive-definite.

2.2. The solution

Consider the equation of motion for a particle in a coupled lattice:

\[ \begin{aligned} x'' + k_{11}(s)x + k_{13}(s)y + k_{14}(s)y' &= 0, \\ y'' + k_{31}(s)x + k_{33}(s)y + k_{23}(s)x' &= 0. \end{aligned} \tag{9}\]

What does space charge do to these equations? For a tilted, uniform density ellipse, it simply modifies \(k_{11}\), \(k_{13}\), \(k_{31}\), and \(k_{33}\). We could replicate the effect of space charge by inserting a large number of linear defocusing elements into the lattice. Call this new lattice the effective lattice, illustrated below.

Fig. 9. Illustration of the effective lattice — a linear lattice that replicates the effect of space charge.

Fig. 9. Illustration of the effective lattice — a linear lattice that replicates the effect of space charge.

The matched beam generates a periodic effective lattice. Such a lattice can be parameterized using the language of coupled single-particle dyanmics. I discussed this in a previous post., but will repeat the necessary info here.

The following figure shows the turn-by-turn trajectory of a single particle in a coupled lattice.

Fig. 10. Turn-by-turn coordinates in a coupled lattice (gray). The projections of the eigenvectors are also shown in blue and red.

Fig. 10. Turn-by-turn coordinates in a coupled lattice (gray). The projections of the eigenvectors are also shown in blue and red.

The turn-by-turn particle coordinates \(\{\mathbf{x}_i\}\) trace a torus in 4D phase space. A matched beam is formed by placing a particle at each of these points since the particles will just trade positions after each turn (\(\mathbf{x}_i \rightarrow \mathbf{x}_{i+1}\)).

Let’s state this again using the eigenvectors of the one-turn transfer matrix. Each particle can be written as a linear combination of these eigenvectors (shown in blue and red):

\[ \mathbf{x} = \sqrt{2 J_1}\mathbf{v}_1e^{-i\psi_1} + \sqrt{2 J_2}\mathbf{v}_2e^{-i\psi_2}. \]

The eigenvectors have amplitudes (\(J\)) and phases (\(\psi\)), and a matched beam is formed by distributing particles along either or both of the eigenvectors with phases ranging uniformly between zero and \(2\pi\). Each eigenvector traces a 4D ellipsoid turn-by-turn. When projected onto any 2D plane, each eigenvector traces an ellipse. Each eigenvector is parameterized by the 4D Twiss parameters \(\alpha_{1x}\), \(\beta_{1x}\), etc.

Our insight was that all particles in the Danilov distribution lie along one vector in four-dimensional phase space. This vector is an eigenvector of some unknown \(4 \times 4\) transfer matrix. This transfer matrix is just the transfer matrix of the effective lattice generated by the matched beam. Thus, we need only to vary the parameters of this eigenvector to find the matched beam. There are six eigenvector parameters in the Lebedev-Bogacz formalism: the beam size in each dimension, the beam divergence in each dimension, the phase difference between \(x\) and \(y\), and the ratio between the \(x\) and \(y\) emittances. We can also choose which eigenvector to use, so there are two possible solutions for each lattice. We can wrap all these parameters into a vector \(\mathbf{p}\).

We can frame this as an optimization problem in which we search for the \(\mathbf{p}\) which minimizes the sum of the squared differences between the initial and final moments when tracking through one period. We utilized two different optimization methods. The first was SciPy’s nonlinear least squares, which worked well in most cases. The second strategy was to track the beam over several periods and compute the period-by-period average of \(\mathbf{p}\), then use this average as the seed for the next round. This figure shows the method converging after a few iterations. The relevant code is found here.

Fig. 11. Convergence of the matching routine.

Fig. 11. Convergence of the matching routine.

3. Simple applications

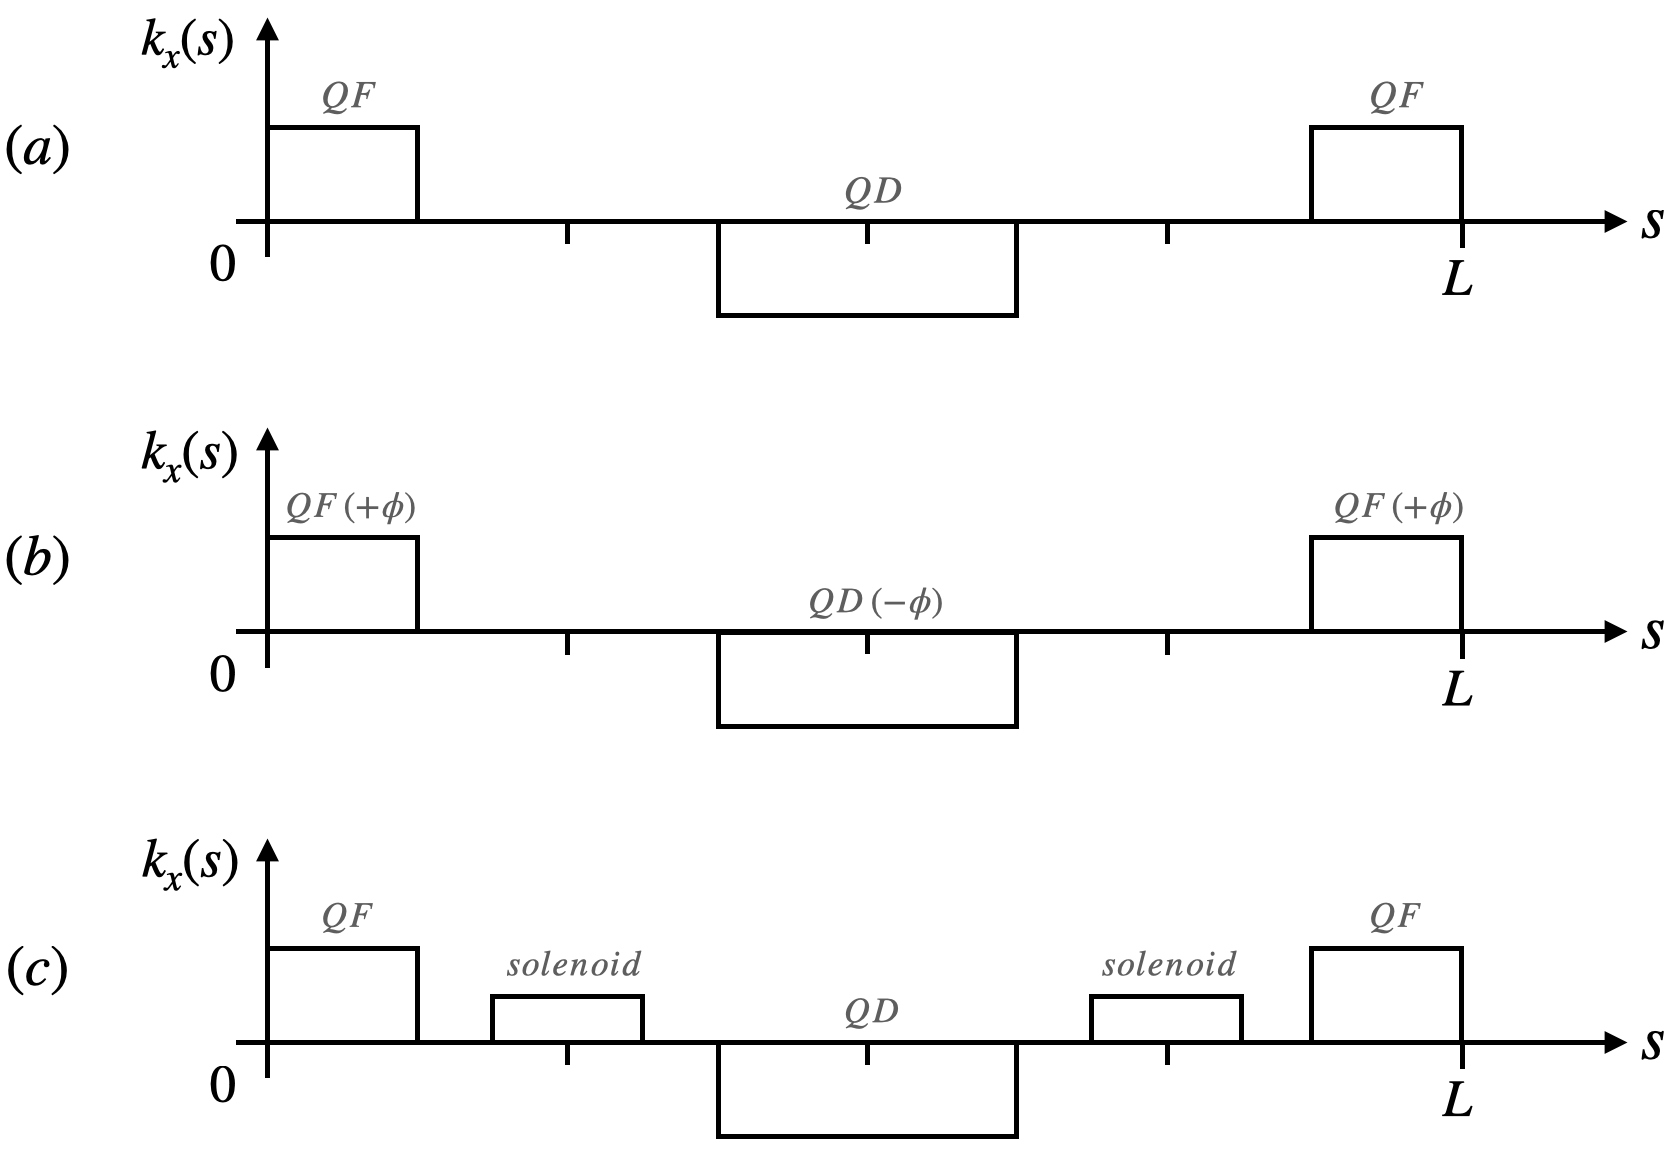
We demonstrated the matching routine in a FODO lattice (Fig. 12a). We also added some variations, like changing the horizontal/vertical focusing ratio, tilting the quadrupoles (Fig. 12b), and adding a longitudinal magnetic field to generate coupling (Fig. 12c).

Fig. 12. Simple lattices used for testing the matching routine.

Fig. 12. Simple lattices used for testing the matching routine.

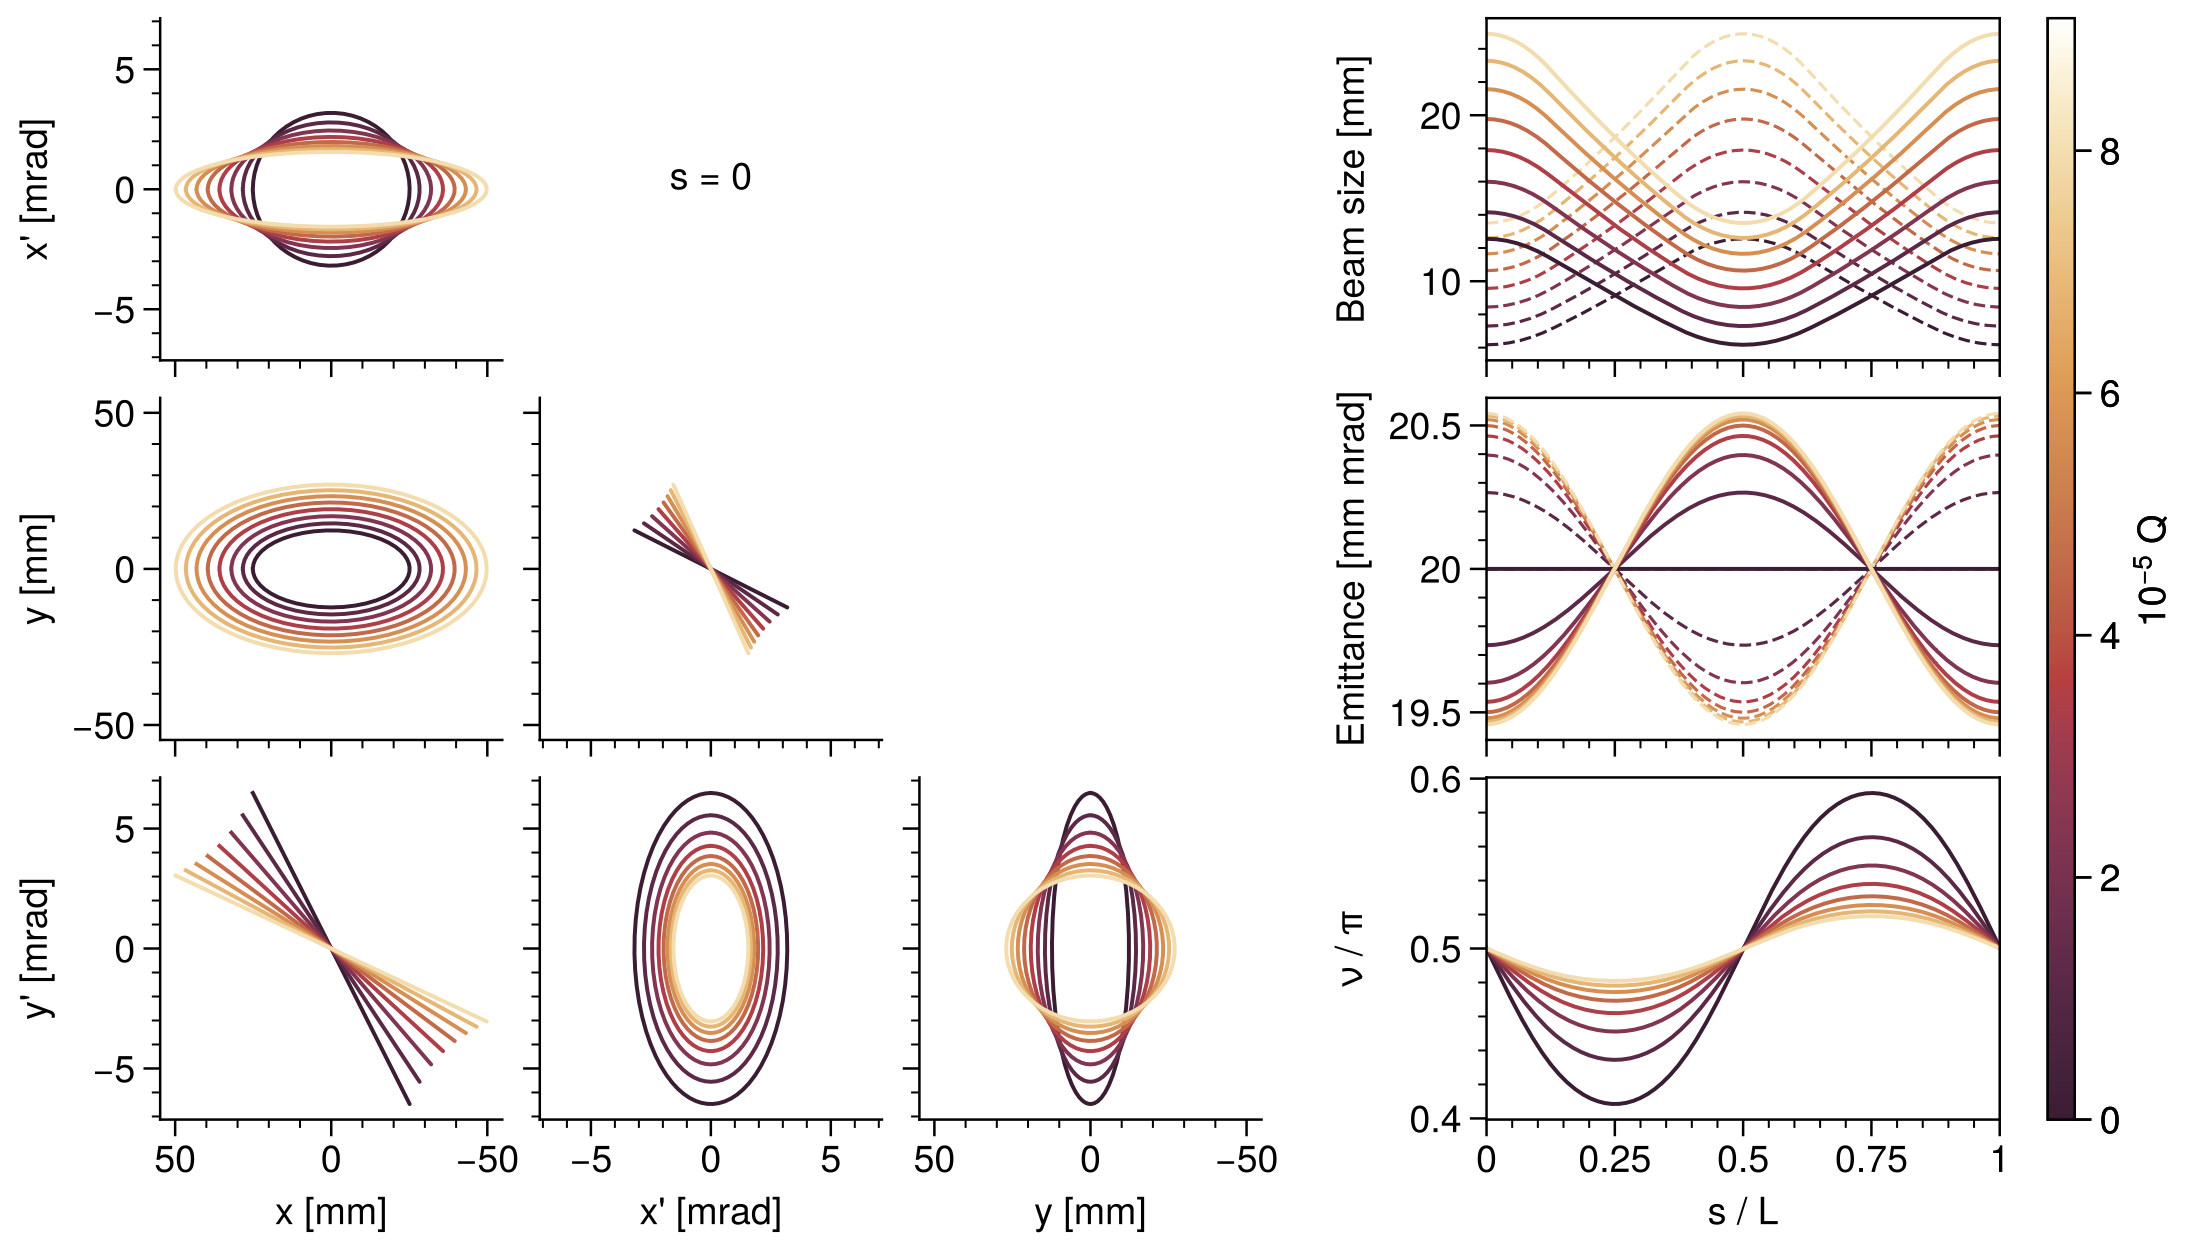
Let’s start with the regular, uncoupled FODO lattice. Fig. 13. Shows the matched 2D projections of the beam at the lattice entrance, as well as the evolution of the beam sizes, emittances, and x-y phase difference within the lattice.

Fig. 13. The “mode 1” (top) and “mode 2” (bottom) matched solutions in an uncoupled FODO lattice. The intensity (Q) is represented by the color scale. In the right columns, solid lines represent x and dashed lines represent y.

Fig. 13. The “mode 1” (top) and “mode 2” (bottom) matched solutions in an uncoupled FODO lattice. The intensity (\(Q\)) is represented by the color scale. In the right columns, solid lines represent \(x\) and dashed lines represent \(y\).

The main takeaway is that space charge scales the matched beam; it does not change its orientation in phase space. Additional observations are: space charge causes emittance evolution within the lattice; space charge encourages the beam to be round (see the bottom-right subplot); the two solutions differ only in the sign of their angular momentum.

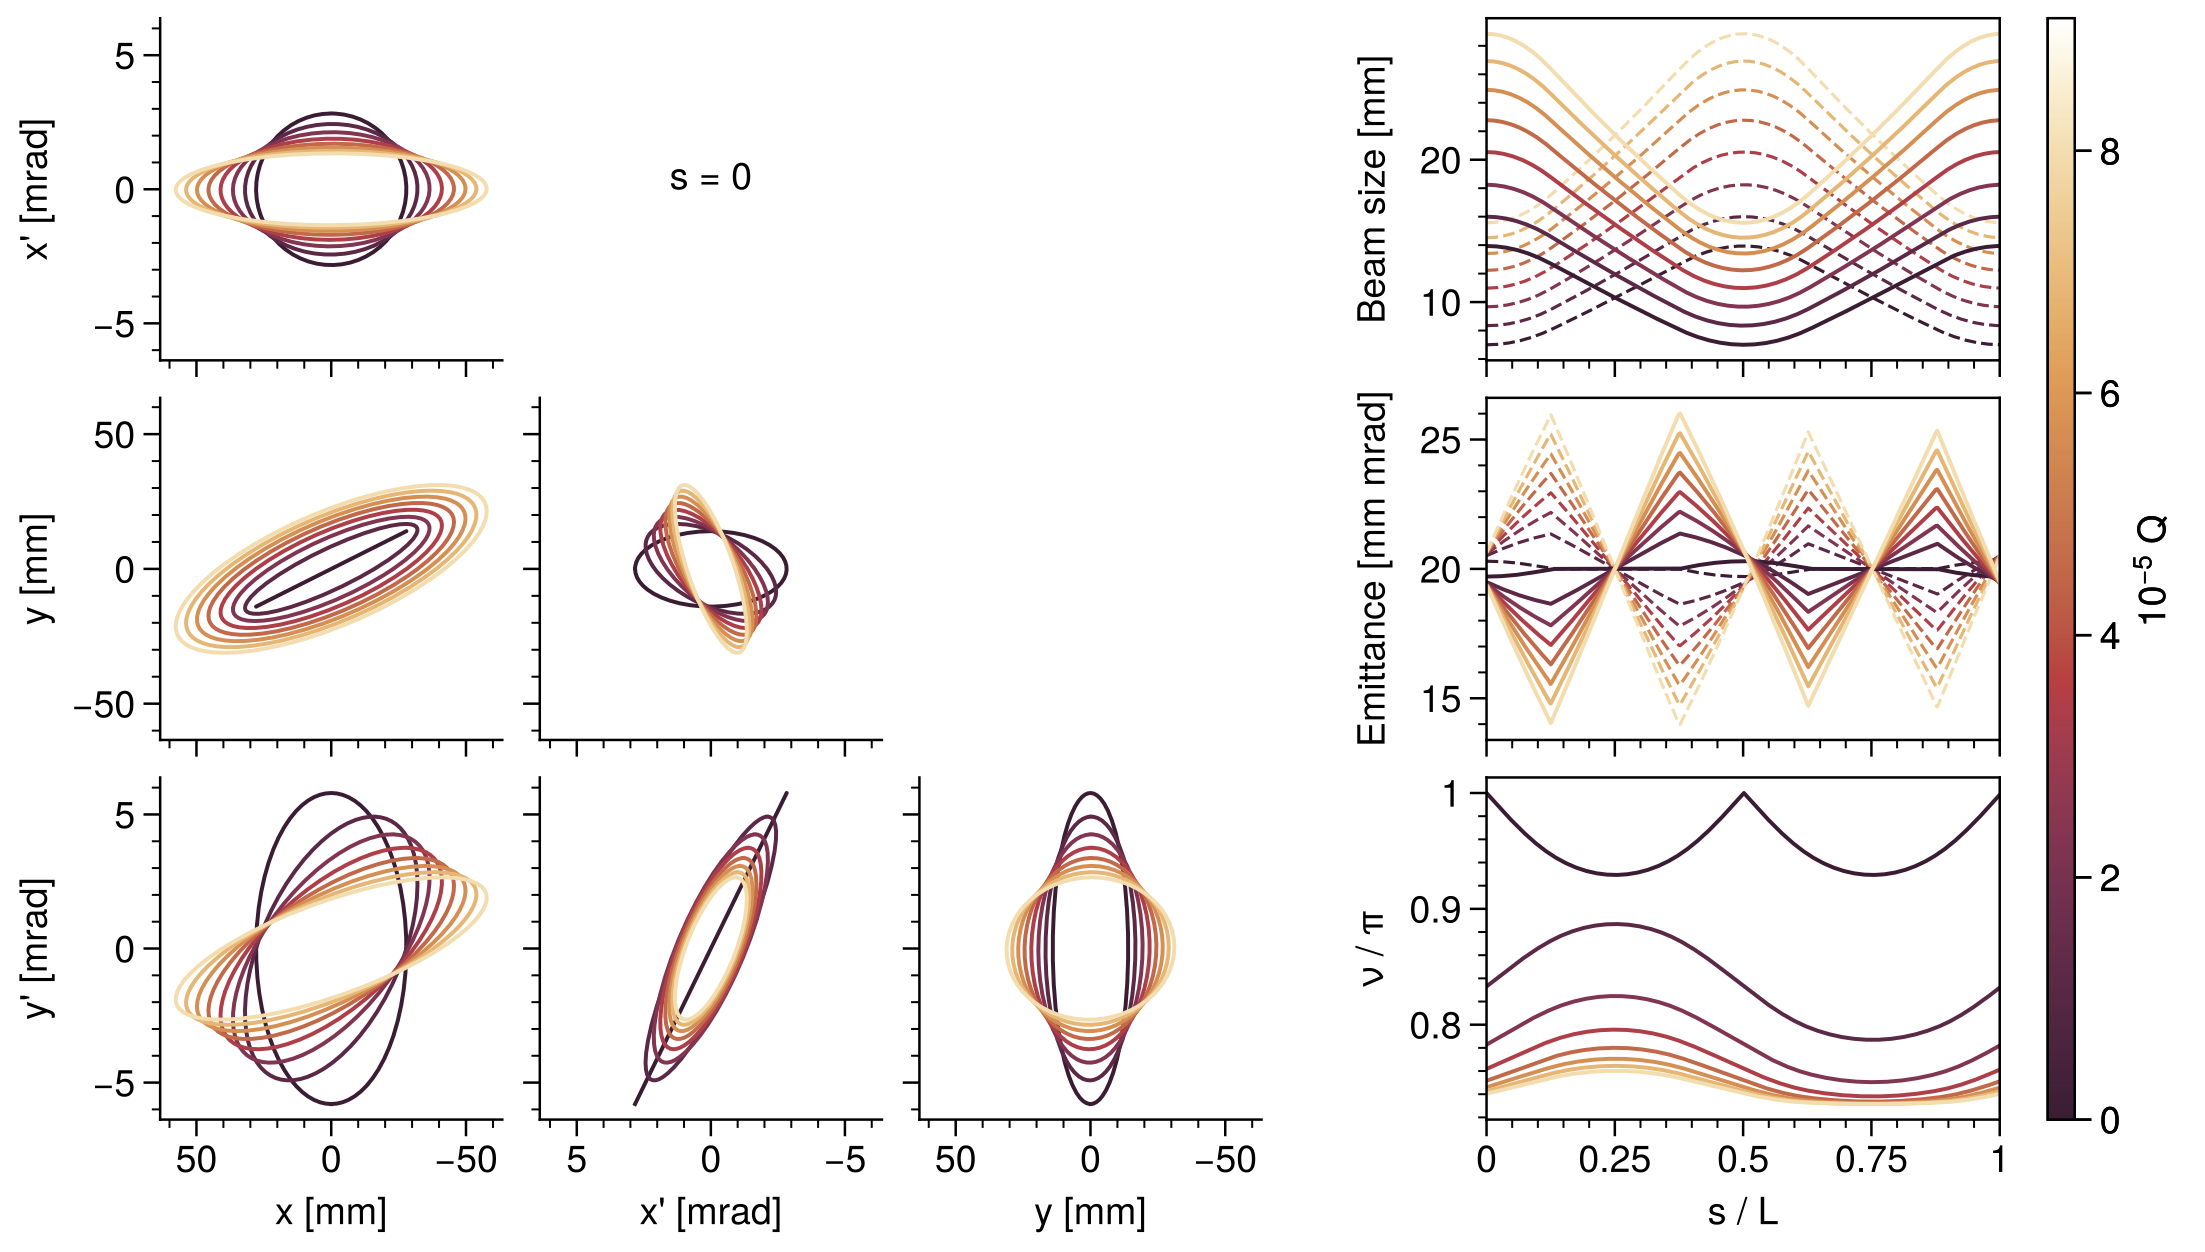
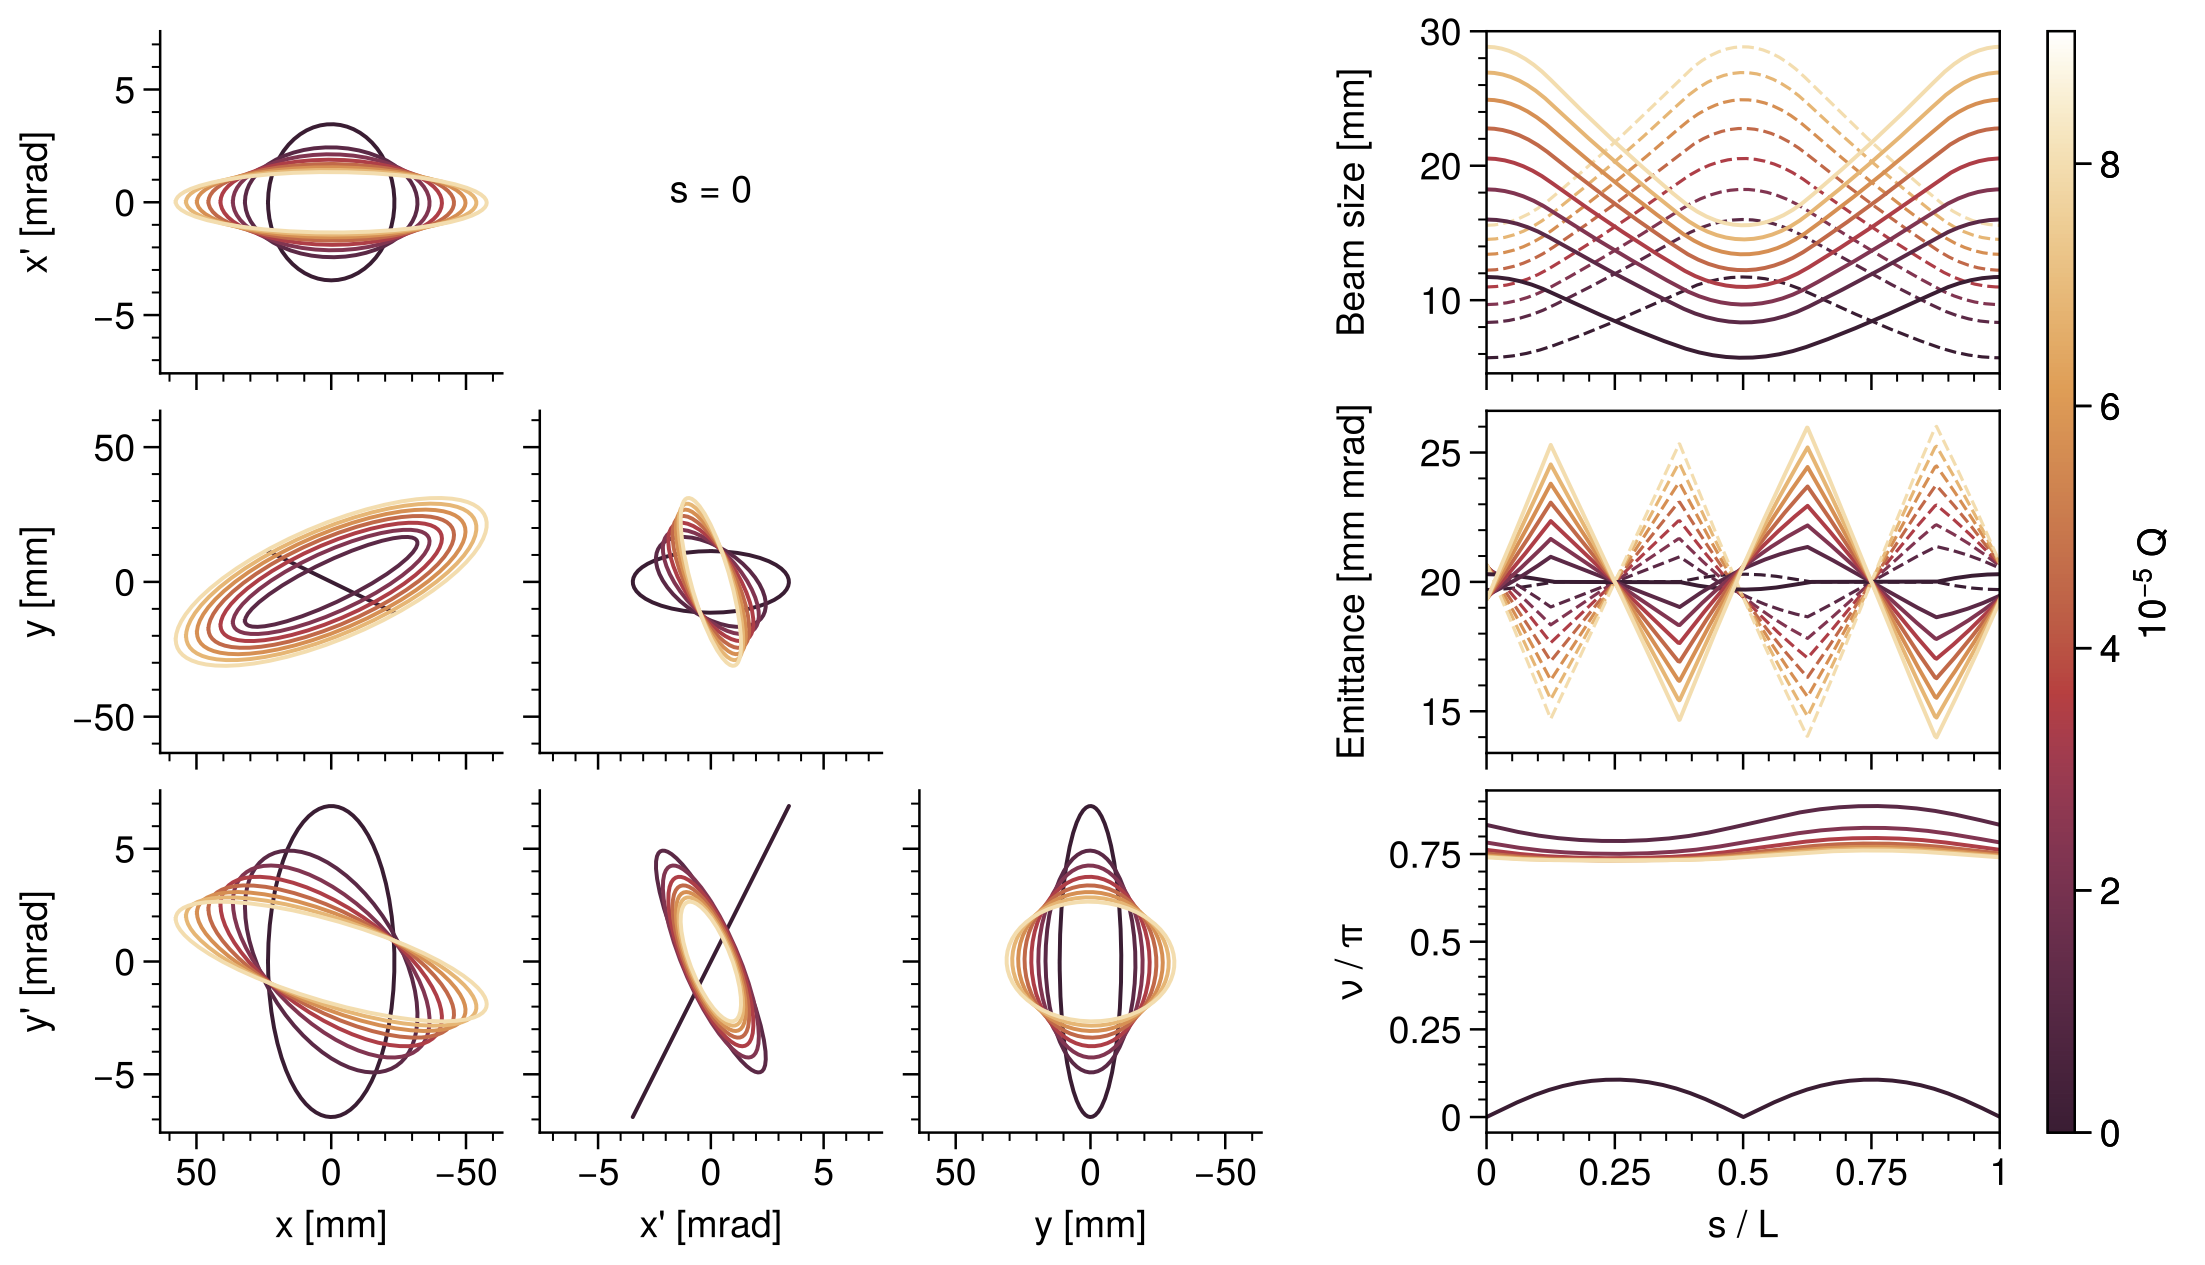
When the quadrupoles are rotated, the matched solution is tilted in the x-y plane. The emittance exchange becomes quite large in this case.

Fig. 14. The “mode 1” (top) and “mode 2” (bottom) matched solutions in a FODO lattice with skew quadrupoles. The intensity (Q) is represented by the color scale. In the right columns, solid lines represent x and dashed lines represent y.

Fig. 14. The “mode 1” (top) and “mode 2” (bottom) matched solutions in a FODO lattice with skew quadrupoles. The intensity (\(Q\)) is represented by the color scale. In the right columns, solid lines represent \(x\) and dashed lines represent \(y\).

Here we noticed an asymmetry in the solutions. The beam always wants to be tilted in the same direction in the \(x\)-\(y\) plane as soon as space charge is turned on.

4. Conclusion

I’ll stop there. I hope this gave a flavor of what went into this paper. In future posts, I will discuss the importance of this matching routine for experiments.

References

[1]
A. Hoover, N. J. Evans, and J. A. Holmes, Computation of the Matched Envelope of the Danilov Distribution, Phys. Rev. Accel. Beams 24, 044201 (2021).
[2]
I. Hofmann and O. Boine-Frankenheim, Parametric Instabilities in 3D Periodically Focused Beams with Space Charge, Phys. Rev. Accel. Beams 20, 014202 (2017).
[3]
J. Galambos, S. Danilov, D. Jeon, J. Holmes, D. Olsen, J. Beebe-Wang, and A. Luccio, ORBIT-a Ring Injection Code with Space Charge, in Proceedings of the 1999 Particle Accelerator Conference (Cat. No.99CH36366), Vol. 5 (1999), pp. 3143–3145 vol.5.
[4]
S. M. Lund and B. Bukh, Stability Properties of the Transverse Envelope Equations Describing Intense Ion Beam Transport, Phys. Rev. ST Accel. Beams 7, 024801 (2004).
[5]
V. Danilov, S. Cousineau, S. Henderson, and J. Holmes, Self-Consistent Time Dependent Two Dimensional and Three Dimensional Space Charge Distributions with Linear Force, Phys. Rev. ST Accel. Beams 6, 094202 (2003).

Footnotes

  1. I discuss this here and here.↩︎

  2. I discuss this here.↩︎

  3. Notice that in Fig. 1., the Gaussian has an approximately uniform core.↩︎

  4. This has only been done for the KV distribution.↩︎

  5. I will discuss this method in future posts.↩︎